Things Learned and Insights
Measures of Position
I was refreshed with the topic of Measure of Position in our
last module for Mathematics 10. Measures of Position are different techniques
and ways of dividing a set of data into equal parts. To make the measurements
valid, the data must be first arranged in an ascending order, meaning from
lowest value to the highest value. There are different types of Measures of
Position and they are categorized by how many times they are divided, namely 4
parts or Quartile, 10 parts or Decile, and 100 parts or Percentile.
Quartile
The Quartiles are actually three values, the QI, Q2 and Q3.
They constitute the values of 25%, 50% and 75%, in that order. Q2 is also known
the median because it determines the middle value or 50%. Q1 is also known as
the lower quartile and Q3 as the upper quartile.

Determining the Quartile:
Ungrouped data
Use the formula:
k(N+1)/4
where k = nth quartile, where n =
1, 2, and 3. N is for the number.
Grouped data
Use the formula:

Where:
LB = lower boundary of the Qk class
LB = lower boundary of the Qk class
N = total frequency
cfb= cumulative frequency of the class before the
Qk class
fq1 = frequency of the Qk class
i = size of class interval
k = nth quartile, where n = 1, 2, and 3
Decile
Deciles are similar to quartiles. But while quartiles sort
data into four quarters, deciles sort data into ten equal parts: The 10th,
20th, 30th, 40th, 50th, 60th, 70th, 80th, 90th and 100th percentiles. D5 constitutes
the 50th rank so it is also the median.
Determining the Decile:
Ungrouped data
Use the formula:
k(N+1)/10 where k = nth decile, where n =
1, 2, 3, 4, 5, 6, 7, 8, and 9. N is for the number.
Grouped data

Where:
LB = lower boundary of the Qk class
LB = lower boundary of the Qk class
N = total frequency
cfb= cumulative frequency of the class before the
Qk class
fDk = frequency of the Qk class
i = size of class interval
k = nth decile, where n = 1, 2, 3, 4, 5, 6, 7, 8, and 9
Percentile
The percentiles are the 99 values of the variable that divide an ordered data set into 100 equal parts.
The percentiles determine the values for 1%, 2%... and 99% of the data.
P50 coincides with the median.
Determining the Percentile:
Ungrouped data:
k(N+1)/100 where k = nth percentile, where n = 1, 2, 3,
..., 99. N is for the number.
Grouped data:

Where:
LB = lower boundary of the Qk class
LB = lower boundary of the Qk class
N = total frequency
cfb= cumulative frequency of the class before the
Qk class
fPk = frequency of the Qk class
i = size of class interval
k = nth percentile, where n = 1, 2, 3, ..., 99
Percentile Rank
Percentile ranks are particularly useful in relating
individual scores to their positions in the entire group. A percentile rank is
typically defined as the proportion of scores in a distribution that a specific
score is greater than or equal to.
Determining the Percentile rank
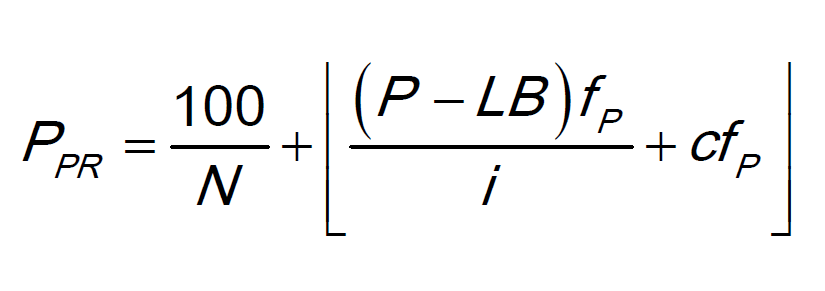
where:
PR = percentile rank, the answer will be a percentage
P cf = cumulative frequency of all the values below the
critical value
P = raw score or value for which one wants to find a
percentile rank
LB = lower boundary of the kth percentile class
N = total frequency
i = size of the class interval
Answering this topic has become a review session for me
because we were taught of this lesson in Grade 8. In our Grade 9, we studied
Basic Statistics and it coved the Measures of Position. In our research, we
used this topic to acquire the needed data. Now in Grade 10, the lesson was
refreshed in our minds.
Concept Map

Difficulties
Measures of Position is a fairly easy lesson in Statistics
so the difficulties are quite minimal. For me, the most difficult aspect of Measures
of Position is calculating the data in grouped data because aside of a long
formula that is very forgettable, the grouped data also consists of other
calculations such as the cumulative frequency. In my Grade 9 year, I always
mess up my cumulative frequency list so the answer that I’ll arrive into is not
exactly the same with the correct answer.
In this case, this lesson mostly prohibits the use of
calculators, especially in the exams, and that means that we have to do the
calculations manually. With that, there is a higher risk for us to do it
mistakenly and thus inaccuracy of the answer. If I forget to solve even just
one part, my mind will be surely thrown over and the best option to do is to
start everything again. It proves to be very tedious especially if it involves
a big set of numbers.
Forgetting to arrange the numbers in an ascending order is
the greatest NO NO in Measures of Position because that would change a great
aspect in ungrouped data and would deem your solution invalid in grouped data.
For me, forgetting to sort the Measures of Position in the correct arrangement
is the greatest horror in Statistics because you really need to start all over
again. Sorting the numbers can be also forgettable because most of the times in
exams, with the overlaying pressure and a limited time, our brains tend to
automatically deal the numbers, forgetting the fact that we need to follow some
steps fist.
Unforgettable Experiences/Activities
I haven’t answered the Lesson 2 of this module because I joined
MTAP but it doesn’t mean that I didn’t experience anything unforgettable in
this topic. When I was in Grade 9, Kayla, the reporter of this lesson had
tasked us to calculate the Measures of Position for a long table. I started at
the top of table and I was devastated to discover that. All my efforts are gone
and I swear, I’ll be careful in every calculations I’ll encounter, but of
course that wasn’t accomplished. That experience is really unforgettable for me
so the next time we answered that type of lesson, I collaborated with my
classmates in order to ensure that we will both arrive at the correct answer
and at the same time, discuss the parts that we got wrong.